Rockstat collects events from your sites and apps into your own ClickHouse and shows them in a dashboard: funnels, journeys, session replay, Web Vitals and an AI assistant. The raw data stays with you.
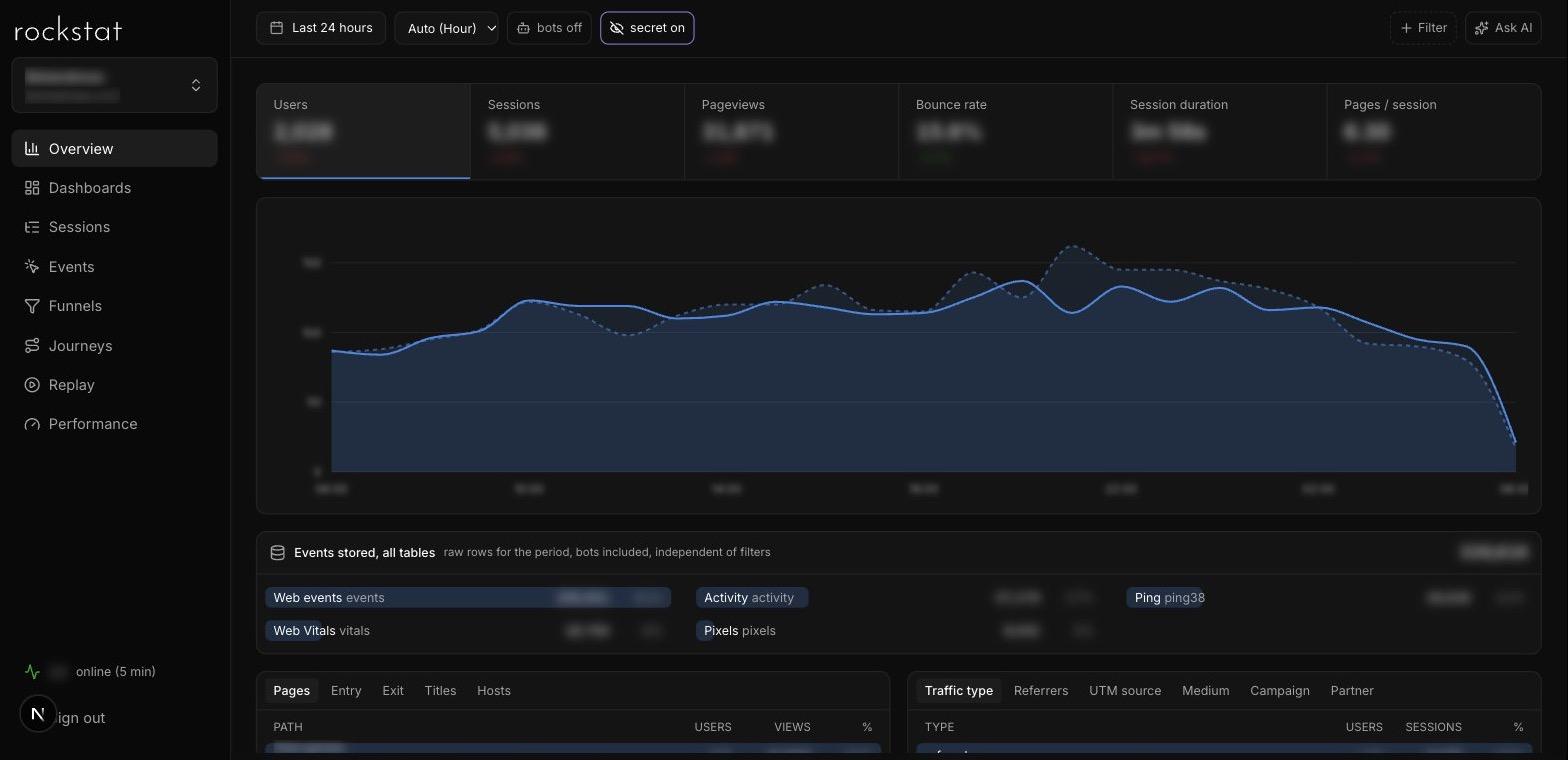
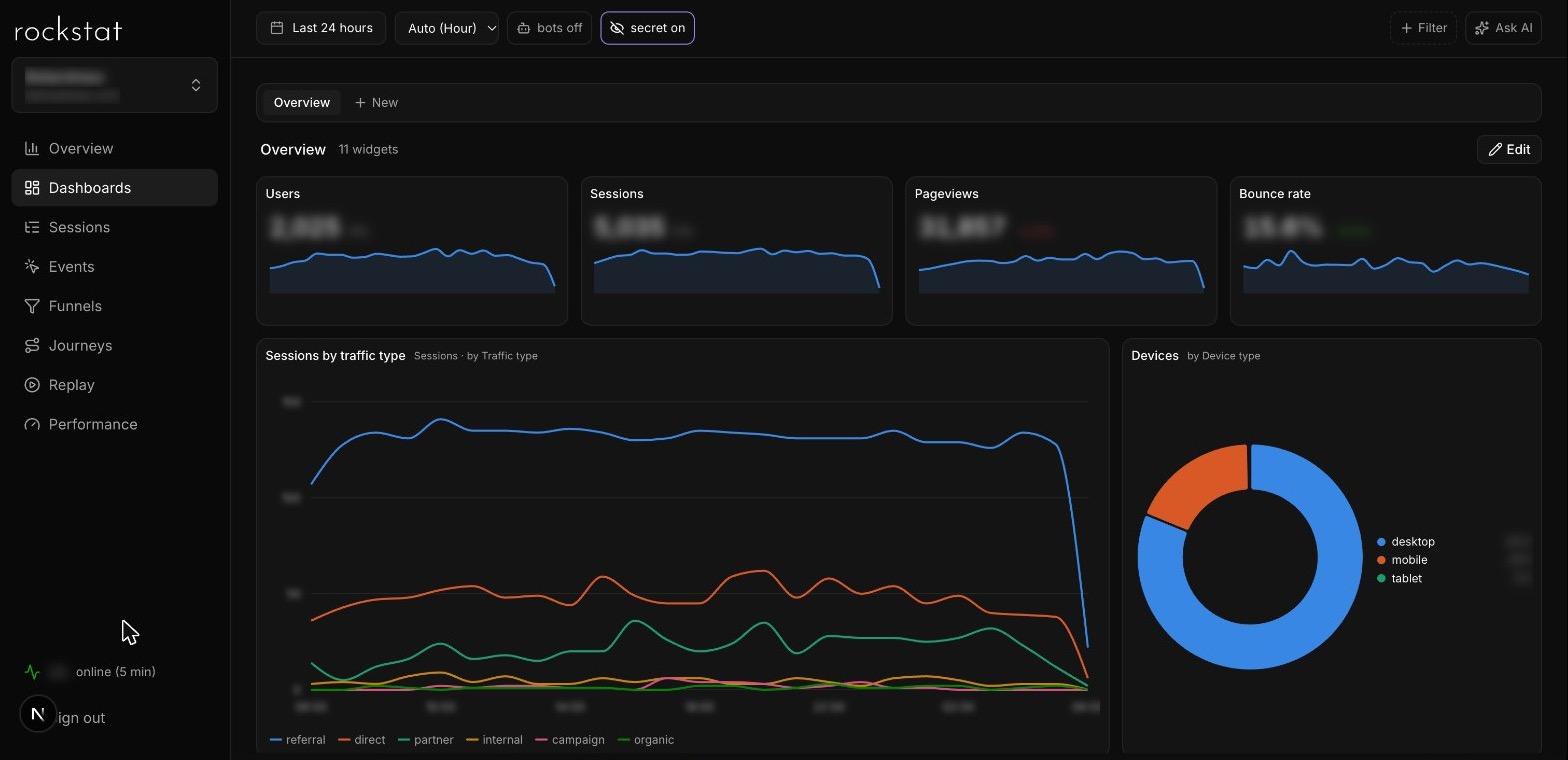
Project overview in the Rockstat dashboard. Figures and URLs in the screenshots are hidden by the secret mode built into the dashboard for demos.
Why self-hosted analytics
What changes when the data stays with you
01
The data is yours
Events are written to ClickHouse on your own server. You can point a SQL client, Grafana or Jupyter at the raw data — no export limits and no third-party APIs.
02
Reports on raw events
No sampling and no ingestion delays. The dashboard reads narrow tables filled by materialized views, so reports build fast even on millions of events a day.
03
Collection from your own domain
The Web-SDK loads from your server and cookies are set on the site's domain. Ad blockers leave the library alone, and the visitor id is shared across all subdomains.
Features
A dashboard that shows the whole user journey
From the big picture of a project down to a single recorded session. Every screen works with one date range and shared filters on any dimension.
Find the step where users drop off
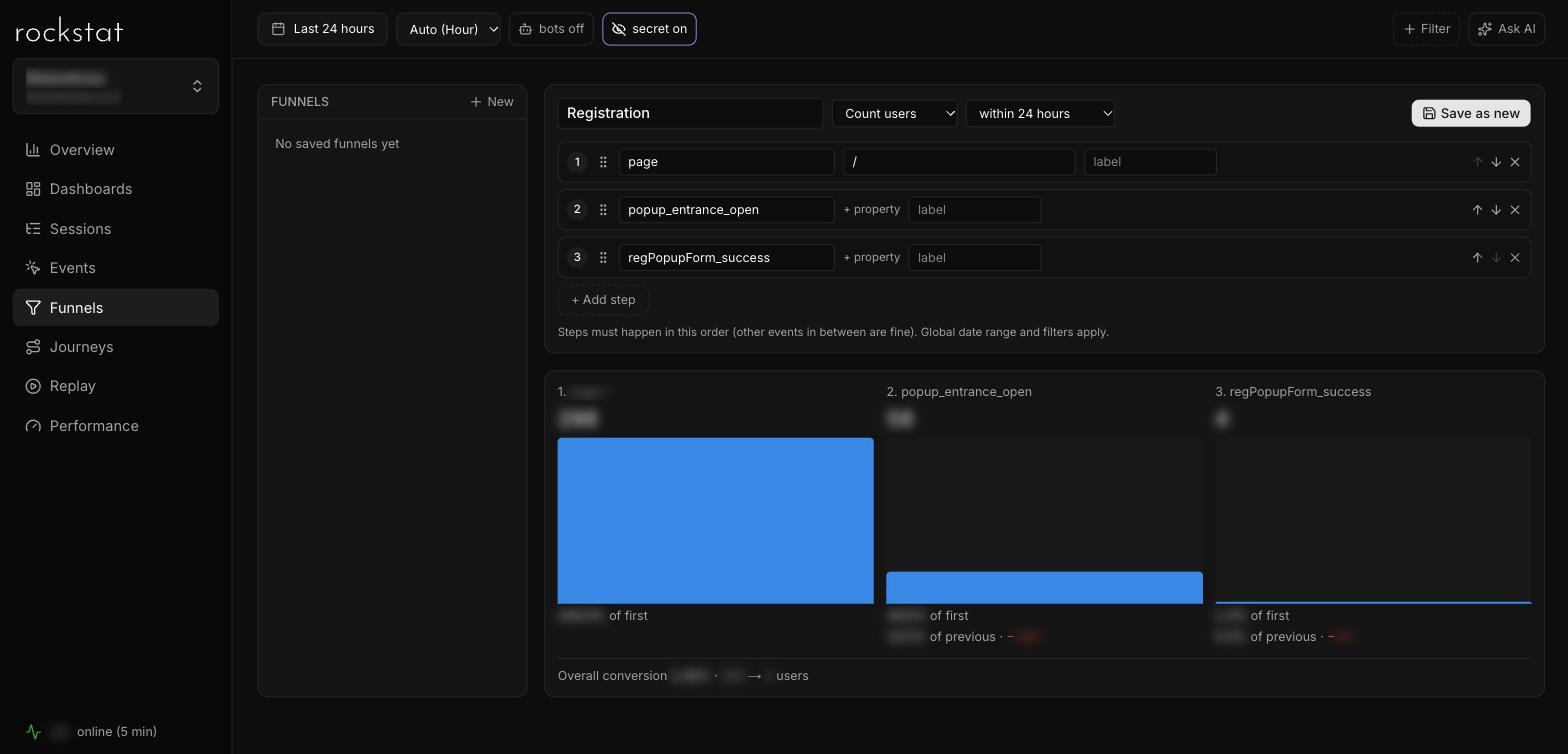
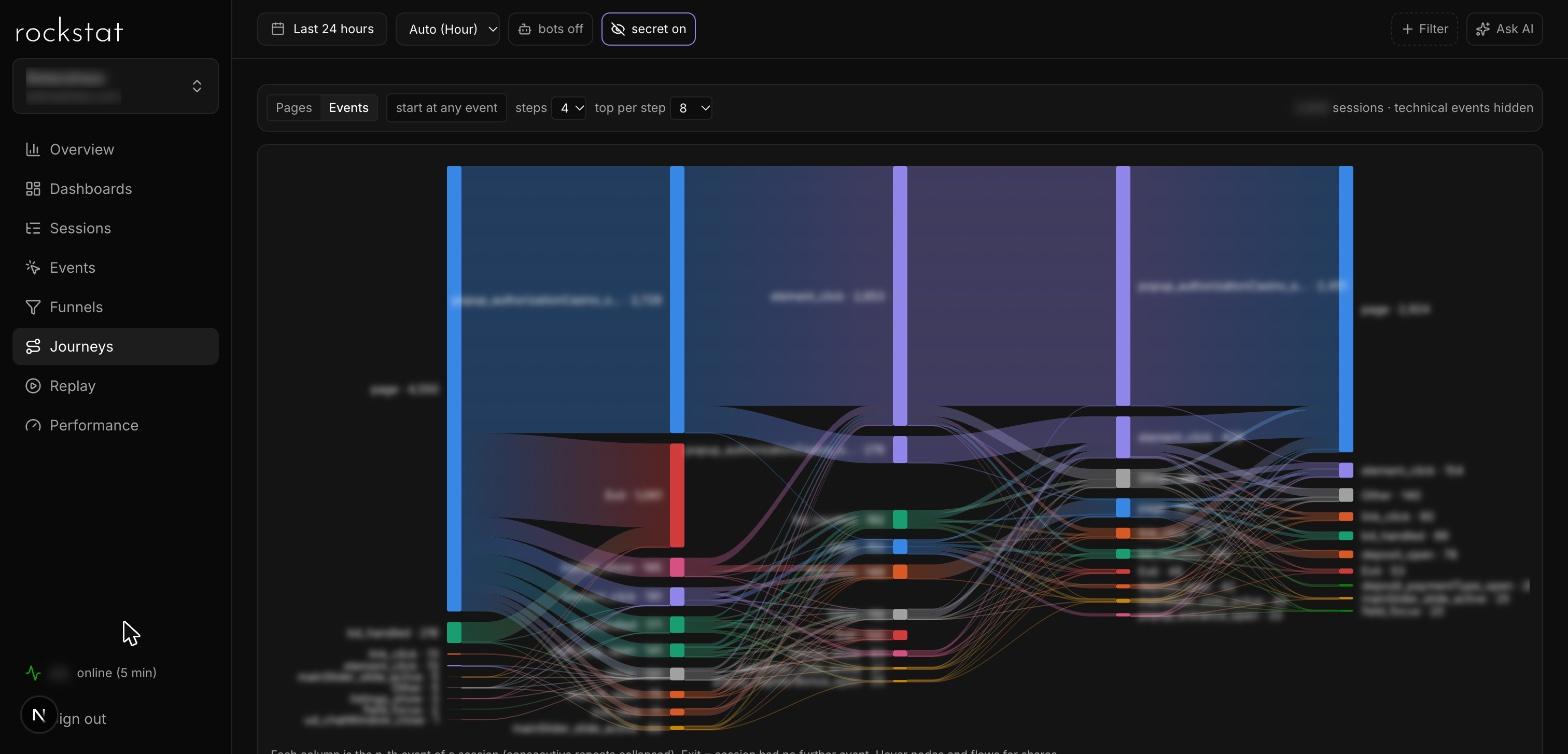
Build a funnel from any events and see how many people reach each step. The journeys diagram shows where they actually go.
Steps by page path or by an event property value
Counting by users or by sessions, with a window between the first and last step
Journeys of two to eight steps, with session exit as a separate node
Break a session down to a single click
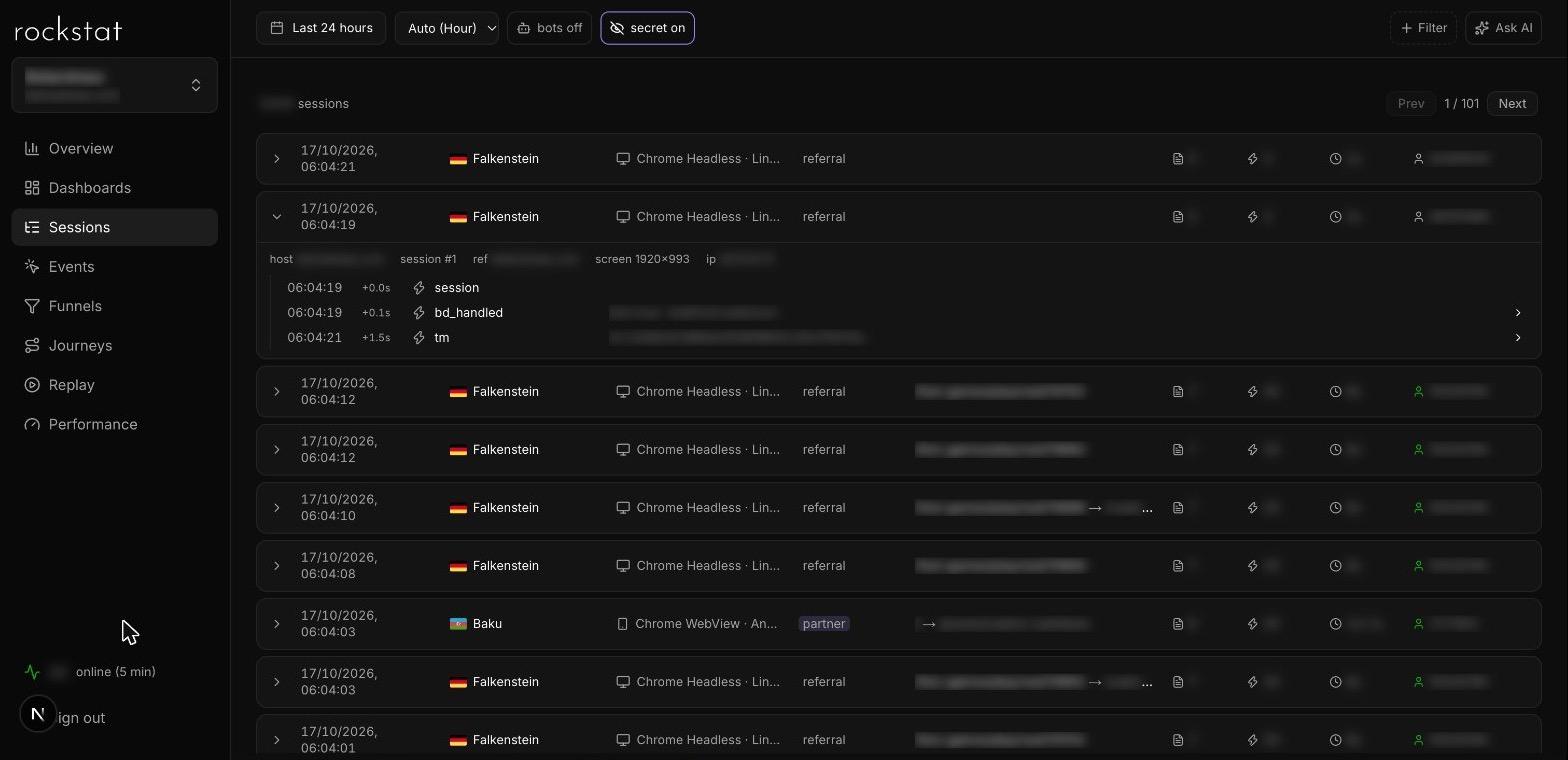
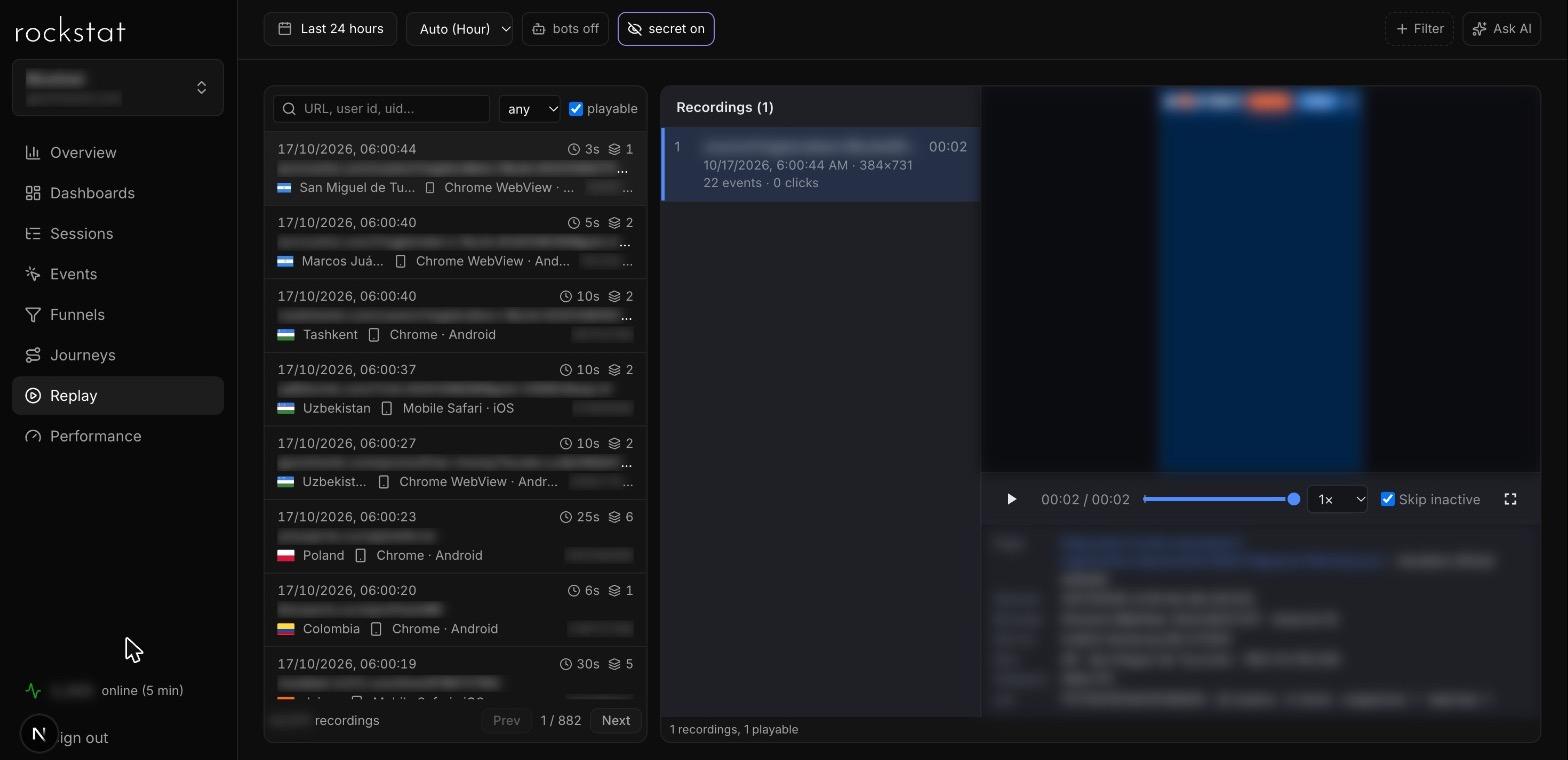
Each session unfolds into a timeline of events with delays and properties. Need to see it through the visitor's eyes — turn on recording.
City, device, source, first page and duration for every session
A player with scrubbing and skip-inactivity
Input fields are masked in the visitor's browser
Assemble your own metrics screen
Several dashboards per project, with widgets you move and resize. The range and filters live in the page URL, so any report can be shared as a link.
Numbers with a sparkline, charts with breakdowns, shares, top values, saved funnels
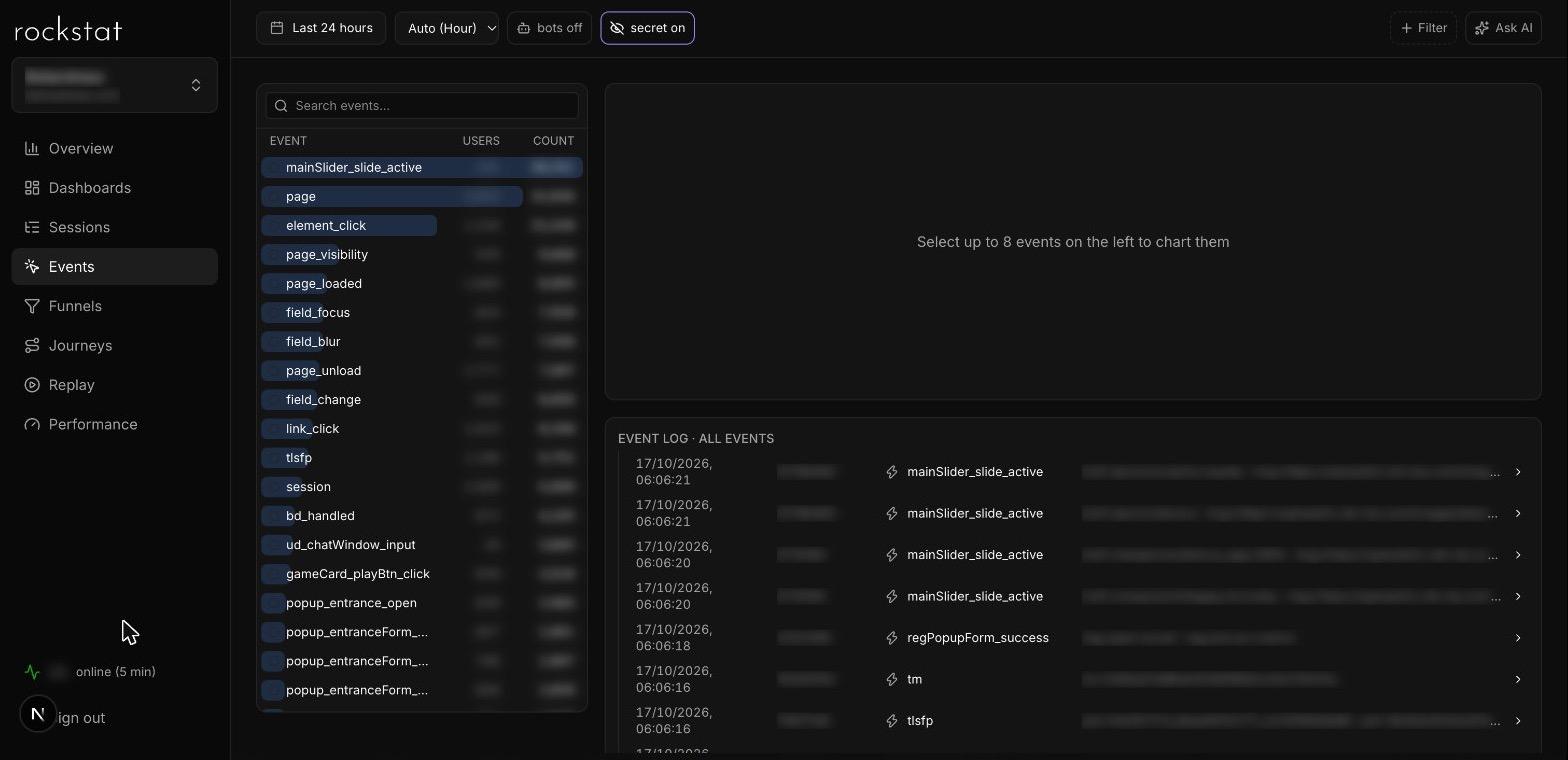
Up to eight events on one chart to compare trends
Clicking a row in any breakdown adds it to the filter
Measure speed for real visitors
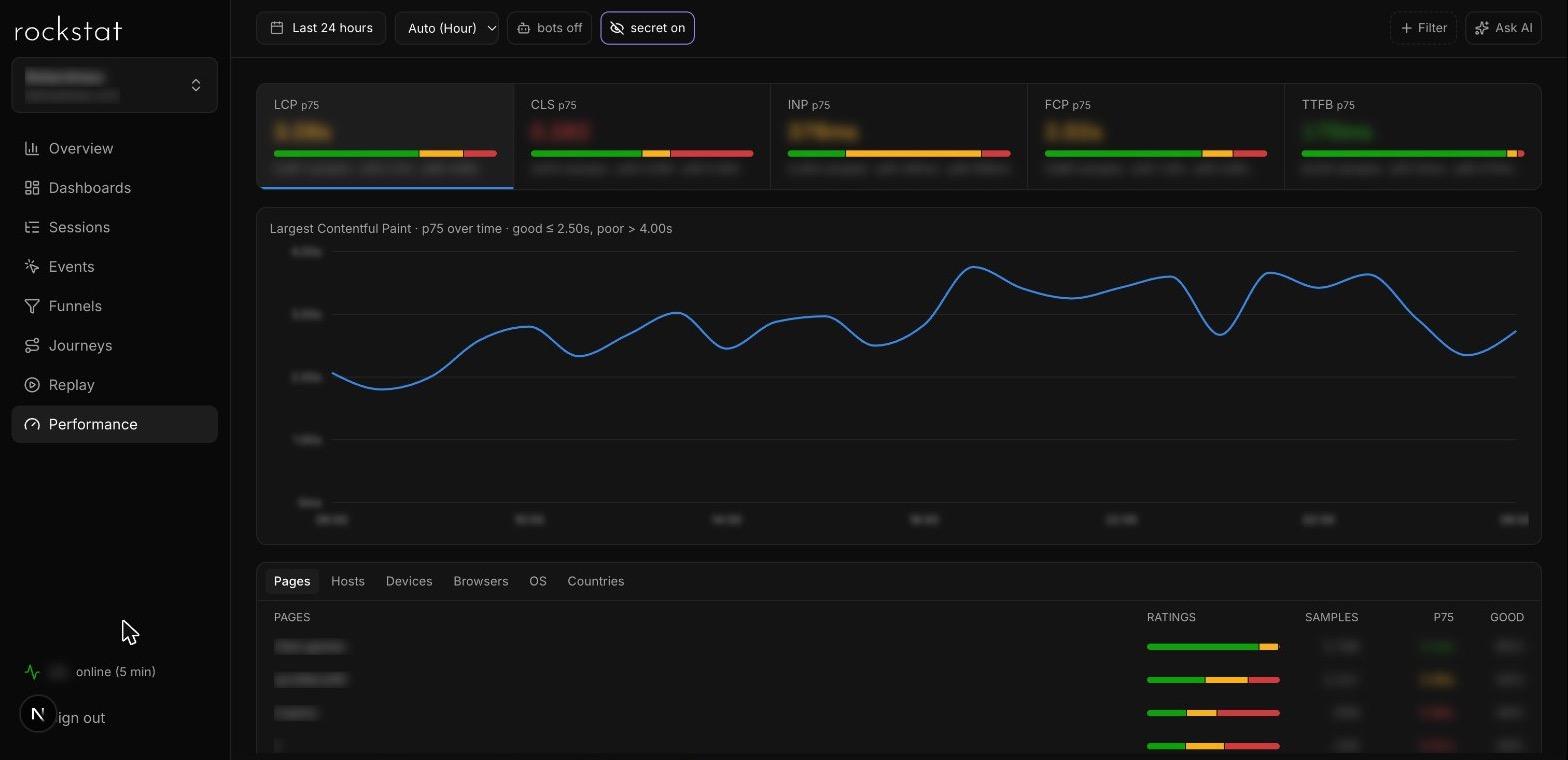
Web Vitals are collected by the Web-SDK in the field, not in a lab: you see how the site performs on real devices and networks.
LCP, CLS, INP, FCP and TTFB
75th percentile, distribution across zones and the trend for each metric
Breakdown by page, device, browser, OS and country
AI assistant
Ask your data a question in plain words
No need to build a report by hand to test a hunch. The assistant goes to the database itself, and you see both the answer and the query that produced it.
Answers in the context of the open report: project, range and filters are already applied
Runs the data queries itself and shows them alongside the answer
Links to dashboard screens where you can dig deeper
The conversation history is kept only in your browser
Ask AIuses the current range and filters
How many users from Bangladesh were there yesterday?
Query to ClickHouse
SELECT uniq(uid) AS users
FROM stats_ui.events
WHERE date = yesterday()
  AND country = 'BD'
Yesterday 412 users came from Bangladesh — 18% more than the day before.
The main source is partner traffic. Details by entry page are in the overview filtered by country.
Ask a question…
Example dialogue. The figures in the answer are illustrative.
Data collection
One snippet on the site — and events are already in your database
The library lives on your own domain and runs itself. Anything the site doesn't cover arrives over HTTP, through a pixel or via webhooks.
index.htmlWeb-SDK 5.2
<!-- loader: creates rstat4 and the call queue -->
<script>
rstat4('configure', { server: 'stat.example.com' });
rstat4('page');
// your own events — with a single functionrstat4('event', 'add_to_cart', { id: '2342344' });
rstat4('identify', 42, { plan: 'pro' });
</script>
Rockstat doesn't ask you to drop your usual counters: the Web-SDK automatically picks up the Google Analytics 4 and Yandex Metrica client id and adds them to every event, so the data can be reconciled across systems.
Page views, clicks, forms, activity, scrolling and tab switching are collected automatically.
HTTP
Mobile apps and servers send events with ordinary GET and POST requests.
1×1 pixel
For emails, AMP pages and anywhere JavaScript can't run.
Webhooks and postbacks
Data from external services, for example installs from Yandex AppMetrica.
Redirects
The link counts the click and forwards the user to the destination.
Mobile apps
SDKs for Android, iOS and Flutter
Apps write events into the same database as the site and link to web sessions by user_id — the whole user journey is visible, from the ad to in-app actions.
Android
Kotlin · Java
A native SDK for apps and Android TV: screens, events and crashes go to your own server.
iOS
Swift
An SDK for iPhone and iPad with background delivery and a buffer in case the network drops.
Flutter
Dart
One package for Android and iOS at once — handy when the app is built from shared code.
Data from every platform lands in a single ClickHouse: funnels, journeys and session replays account for both the site and the apps. We wire up mobile SDKs individually — message us in the chat and we'll help for your platform.
Rockstat collects what others lose, verifies where events come from, and brings web, mobile apps and external services into one database.
Device and browser data
Battery and network
Charge level, charging status and connection type — Wi-Fi or cellular — where the browser exposes them.
Client Hints
Browsers hide the full version in the User-Agent — the Web-SDK requests it separately.
Web Vitals
LCP, CLS, INP, FCP and TTFB from real visitors, not from a lab.
Browser and TLS fingerprints
A browser fingerprint and the connection's SSL/TLS fingerprint; deep browser fingerprints as a separate service.
Data integrity
Signed requests
Events are signed, so forged requests never make it into the database.
Multi-account detection
Fingerprints and identifiers help link several accounts on the same device.
Your own geo databases
Plug in your own geolocation databases so the region in analytics matches your order data.
Sources and channels
More session types
Beyond the usual sources — separate partner (CPA), internal and webview.
Any webhooks
Accept postbacks and events from third-party services straight into your stream.
Tracking redirects
Short links like bit.ly, but with tracking of what happens next. Plus a 1×1 pixel where JavaScript can't run.
How it works
A transparent pipeline from request to report
Every event follows the same path, and at any point you can enrich it, process it or send it to an external system.
Sources
Sites and apps
Web-SDK, HTTP requests, pixel, webhooks
Ingest
Front
Accepts the request and assigns the event a routing key
Enrichment
Enrichers
Region by IP, User-Agent parsing, your own logic
Storage
ClickHouse
chwriter writes events; your own fields are added in the configuration
Analysis
Dashboard and SQL
The Rockstat dashboard, Grafana, Jupyter, any SQL client
Extended with your own services
Rockstat services are independent Node.js processes that talk over Redis Pub/Sub with JSON-RPC 2.0 messages. The rock-me-ts library takes care of configuration, logging, metrics and RPC — the business logic is up to you.
Receives the stream of finished events. That's how writing to ClickHouse and streaming to Kafka work.
Enricher
Adds data to an event before it reaches storage.
Handler
Answers an incoming request and builds the HTTP response for the client.
Open source
This platform is yours
No vendor lock-in: the code is open, the data lives with you, and the stack is built from standard components.
Open code
The source is distributed under the Apache 2.0 license: you can study the platform, modify it and use it in commercial projects.
Your server
Rockstat installs on your own infrastructure. Events are stored in your own ClickHouse, not in someone else's cloud.
Careful with visitors
Form field values are not collected by default. In session replay, input fields are masked in the browser, and values can be encrypted with a public RSA key when needed.
Familiar technologies
ClickHouse, Redis, Docker, Node.js and TypeScript. The event stream can also be sent to Kafka in parallel.
“We use Rockstat as our main web analytics tool — we collect events into our own database, measure experiment results and set up alerts.”
Artem Shevchenko, Utair
“We built end-to-end analytics and our own cross-domain attribution model. Thanks to that, we successfully reallocate budgets across channels.”
Konstantin Podyakov, pride.marketing
Trusted by
Companies already collecting their data with Rockstat
From an airline and an ad network to product teams and agencies — all keeping their events in their own database.
Adsterra
pride.marketing
Getting started
Three steps to your first events
01
Prepare a server and a domain
You need a dedicated server with a fresh OS — 2+ cores, 8 GB of RAM and 60 GB SSD — and a subdomain like rstat.mysite.com pointed at it.
The ingest, enrichment and event-writing services, ClickHouse and the dashboard are installed automatically. The installer is currently being updated for the current set of services — the guide will appear in the docs.
The platform is free and distributed under the Apache 2.0 license. You only pay for your own server.
Where is the data stored?
In a ClickHouse database on your own server. Raw events are available directly: via SQL, Grafana or Jupyter.
Do I have to drop Google Analytics or Yandex Metrica?
No. Rockstat runs alongside them. The Web-SDK automatically picks up the GA4 and Metrica client id and adds them to every event, so the data can be reconciled across systems.
What is collected without extra configuration?
Page views, clicks, form interactions, activity, scrolling, tab switching and Web Vitals. Session replay is turned on on request. Custom events are sent with a single function.
How is visitor data protected?
Form field values are not collected by default. In session replay, all input fields are masked in the browser, and specific parts of the page are excluded with CSS classes. If you do need field values, they can be encrypted in the browser with a public RSA key — only your server can decrypt them.
Can I send data from more than the website?
Yes. Mobile apps and servers send events over HTTP, there's a pixel for emails and AMP pages, webhooks and postbacks for external services, and redirects for links.
Can the platform be customized for my needs?
Yes. The platform is extended with your own TypeScript services: an event can be enriched, processed in real time or sent to an external system. The docs include a guide based on real working services.
Analytics that stays with you
Rockstat deploys on your own server and shows your product from your own data.