Documentation
About the Rockstat platform
What Rockstat is, how data collection works, what steps are needed to get started, and what the analytics dashboard can do
Rockstat is a web and product analytics platform that you deploy on your own server. Events from websites and apps land in your ClickHouse database, the raw data stays with you and is available for any queries. The analytics dashboard runs on top of the data: project overview, sessions with an event feed, funnels, user journeys, session replay, Web Vitals, and an AI assistant. The platform is extended with your own services: any event can be enriched, processed, or sent to an external system.
How it works#
- Web-SDK on your site's pages collects pageviews, clicks, form interactions, activity, Web Vitals metrics, and, on demand, records a session for replay. Mobile apps and servers send data via HTTP, a pixel, or webhooks.
- Front receives requests, assigns a routing key to every event, and runs it through enrichers: region detection by IP, User-Agent parsing.
- chwriter writes events to ClickHouse. The table structure is described in the configuration, and your own fields are added without touching the code.
- The Rockstat dashboard reads narrow tables from ClickHouse that are populated by materialized views, so reports build quickly even with millions of events per day. The raw data stays directly accessible: SQL, Grafana, Jupyter.
Analytics dashboard#
The dashboard opens at https://<your domain>:2083/ui and is protected by the password set during
installation. On the left are the sections; at the top are settings common to all sections: period and
grouping step, bot handling, filters by any dimension, and the AI assistant button. The period and filters
are kept in the page URL, so any report can be shared as a link.
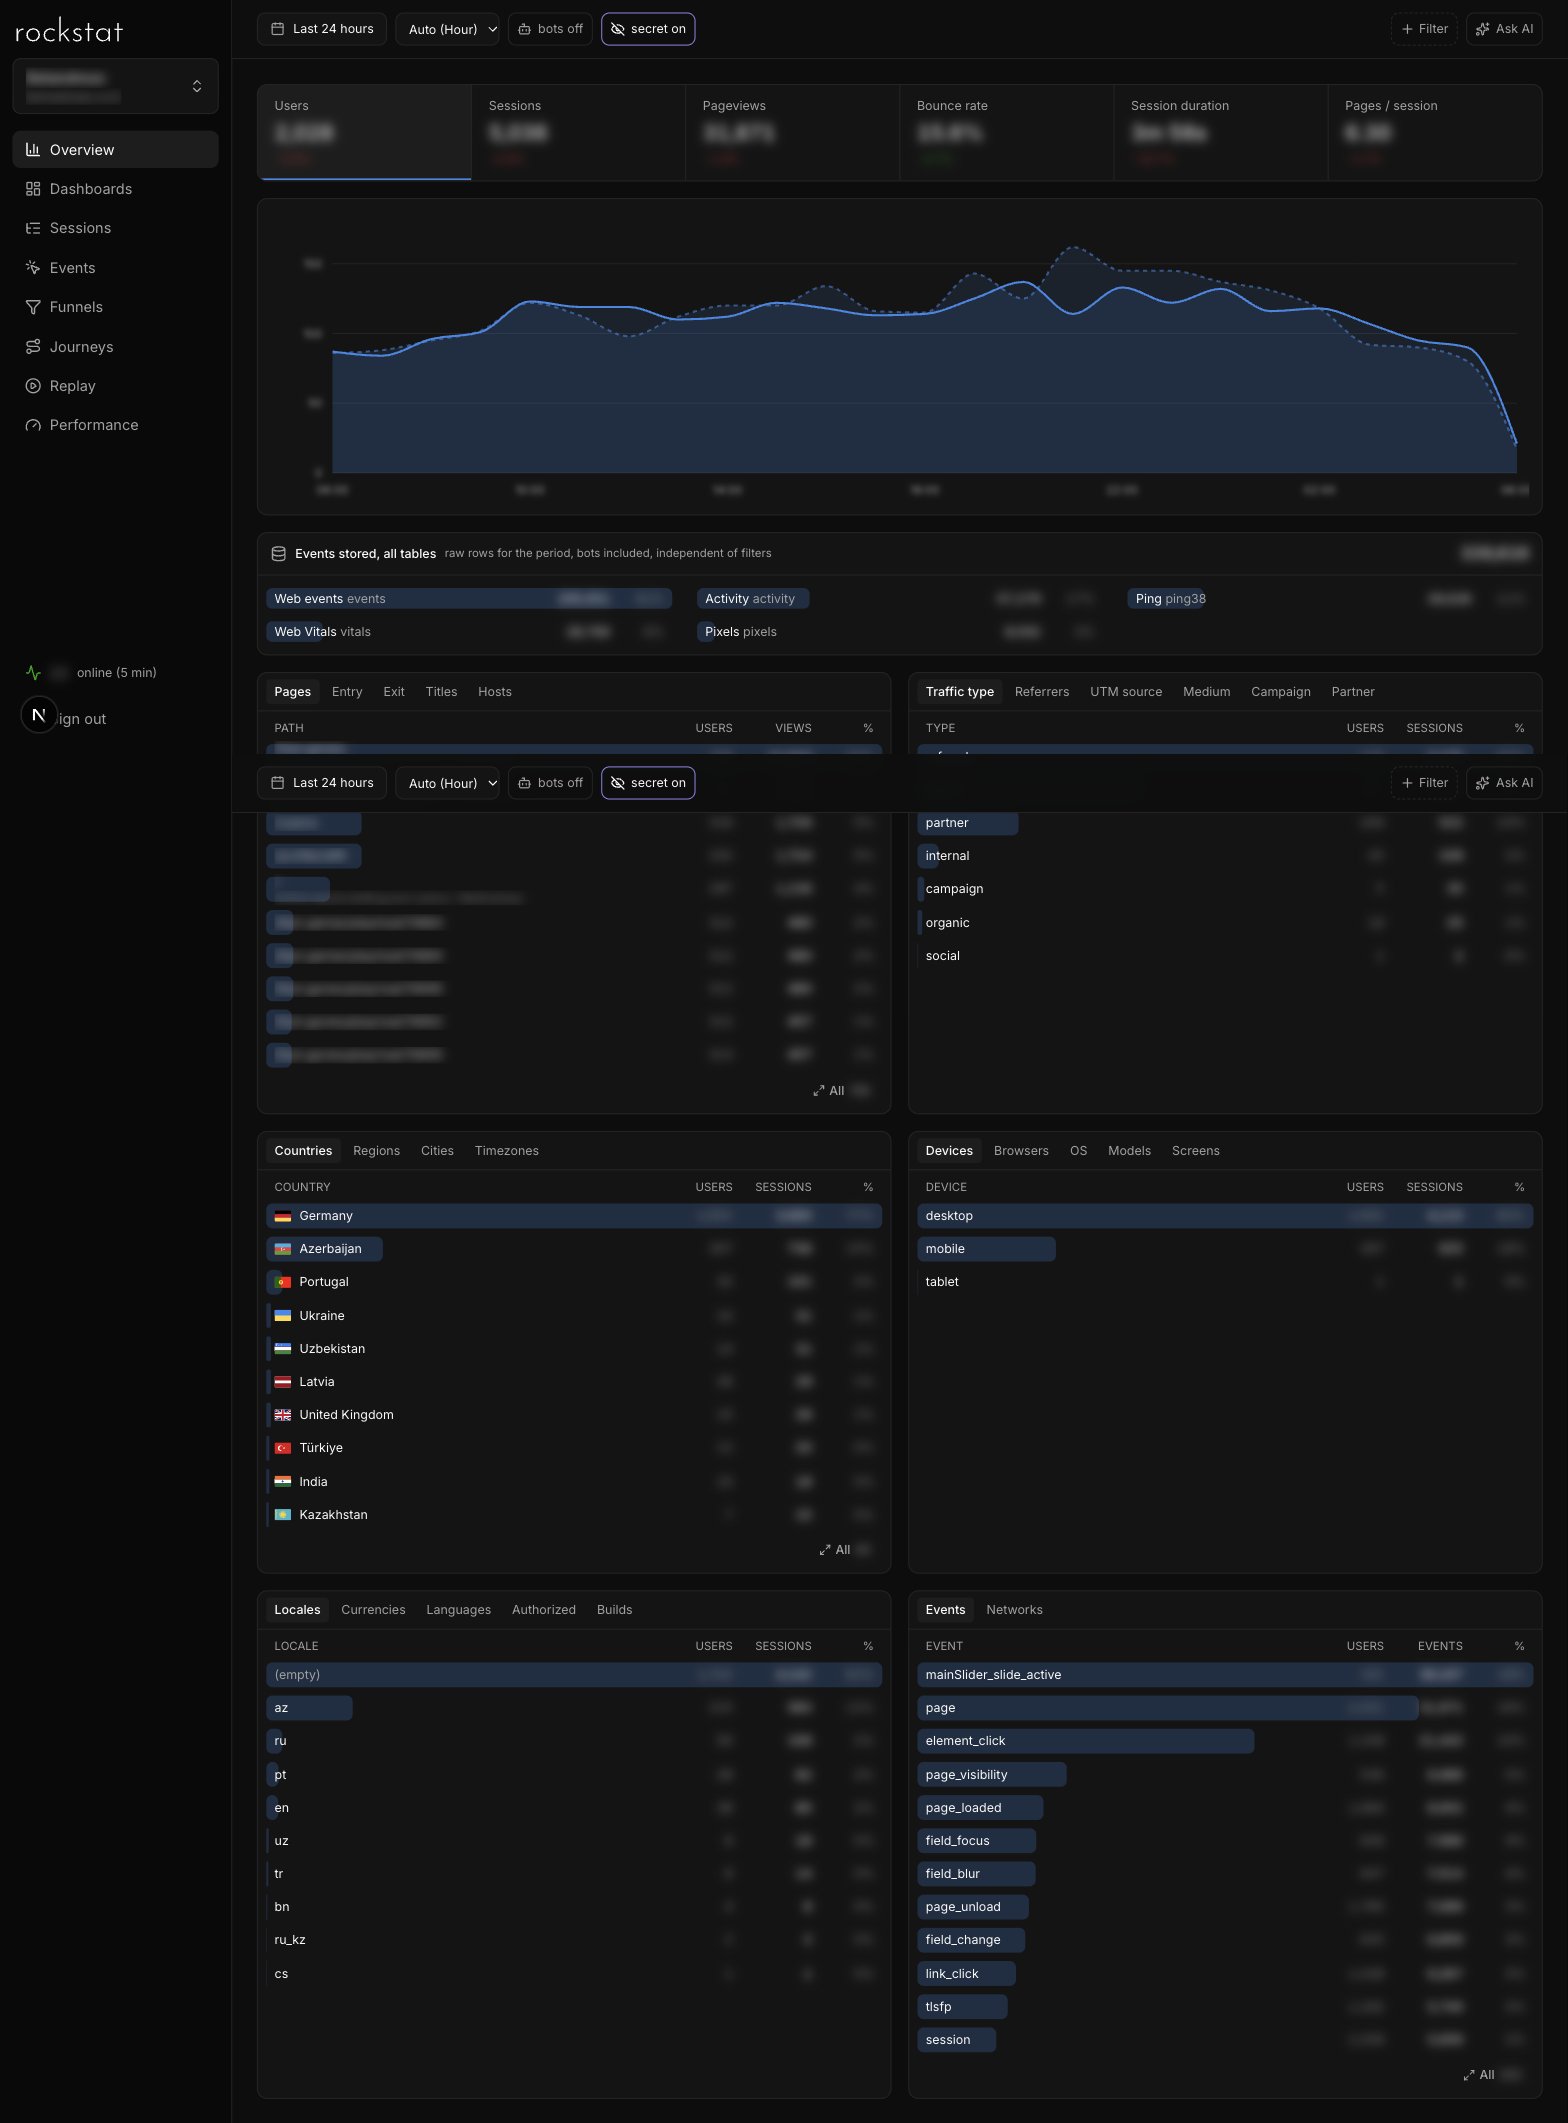
The secret toggle replaces domains, paths, and IP addresses with fictional but stable values.
This way the dashboard can be shown in demos and screenshots without revealing the site. All screenshots
on this page were taken in this mode, so the addresses, names, and figures in them are blurred.
Overview#
Key metrics for the period with the change versus the previous one: users, sessions, pageviews, bounces, session duration, and depth. Below are a chart and breakdowns by pages, traffic sources, UTM tags, geography, devices, browsers, and locales. Clicking a row adds it to the filter.
Dashboards#
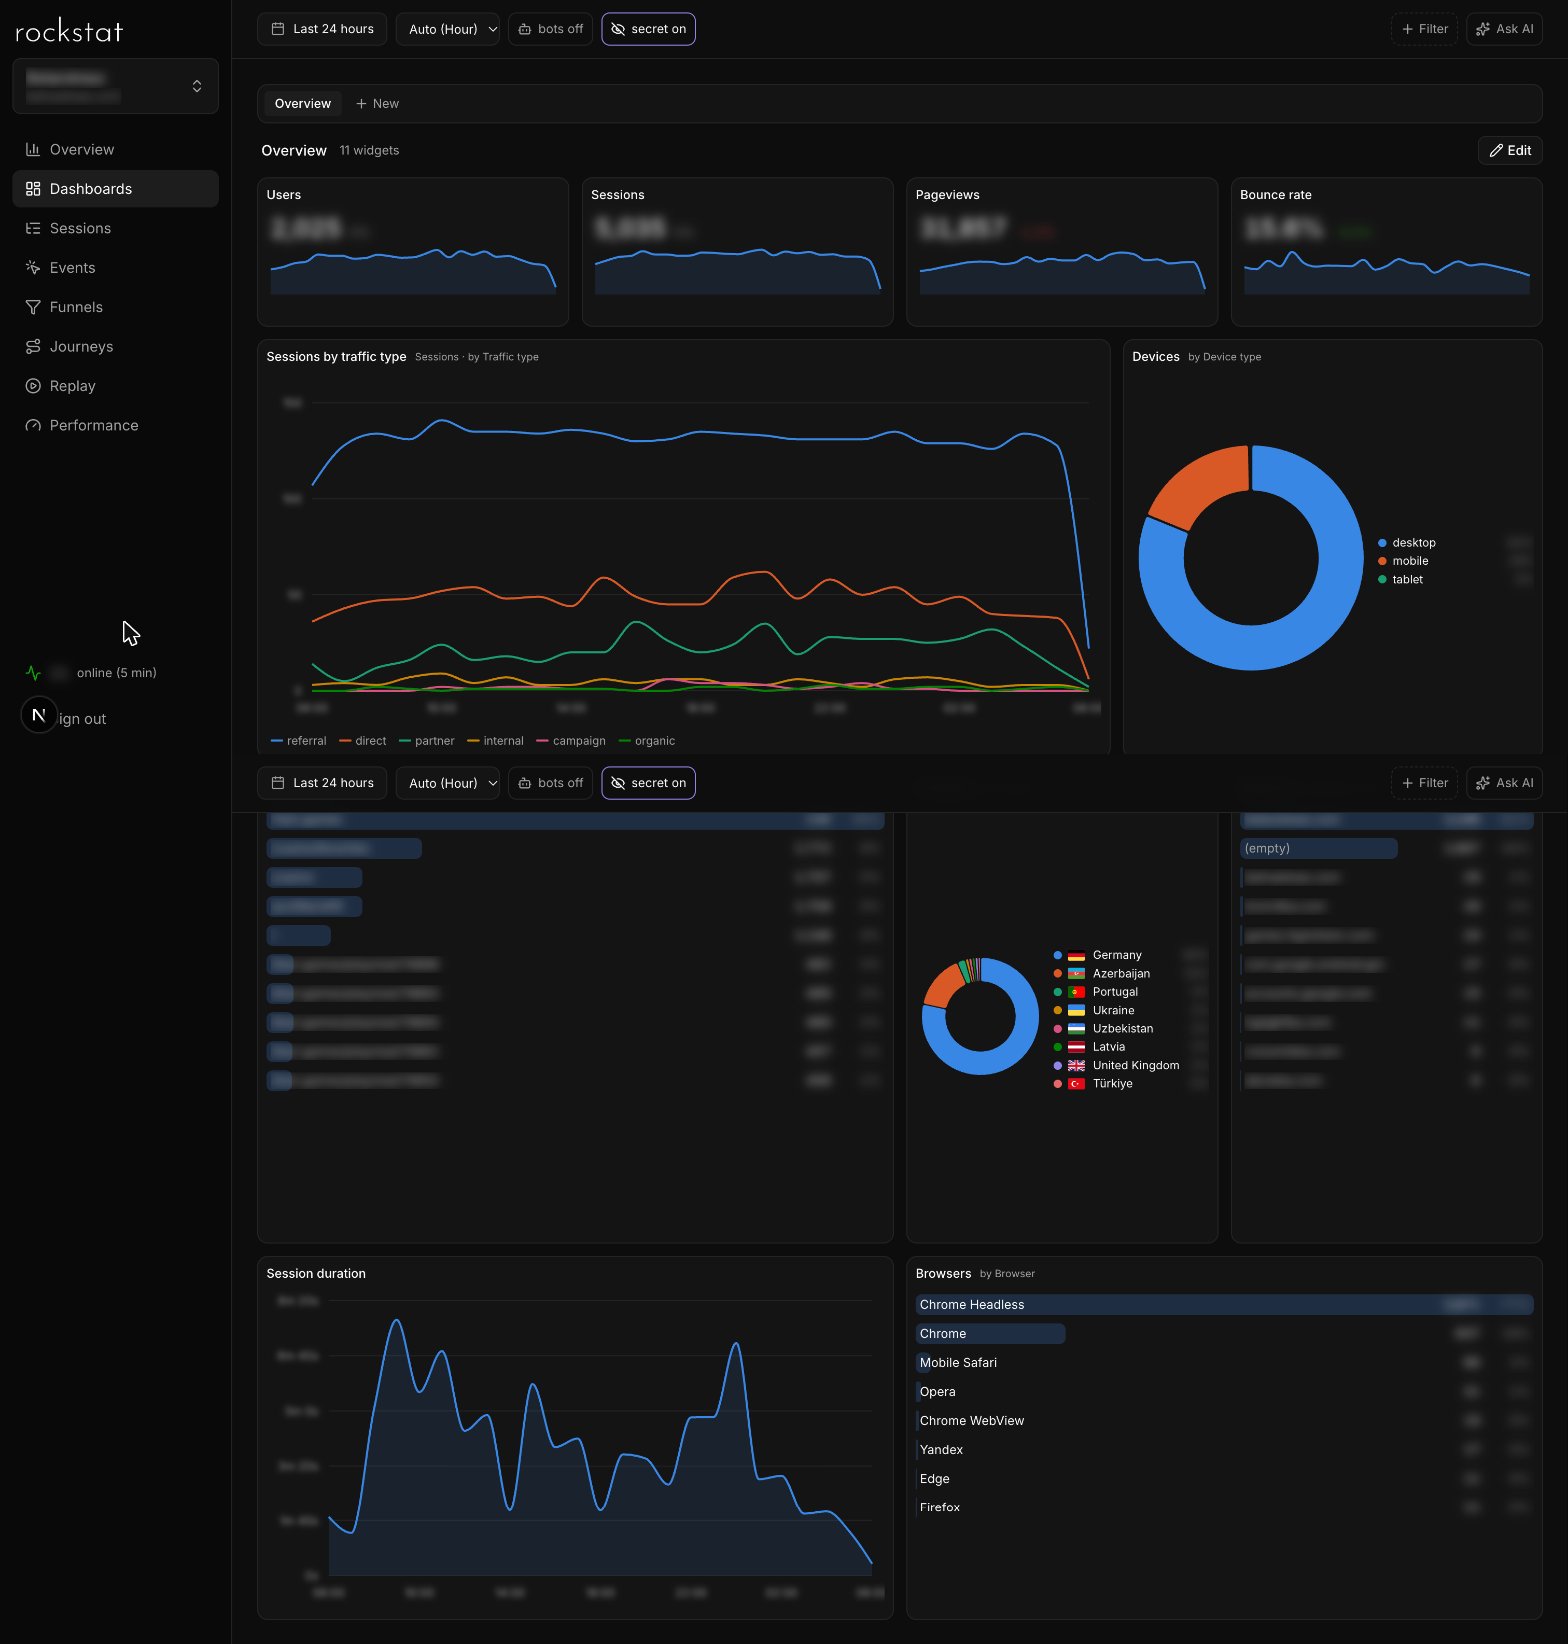
Several named dashboards per project, each a grid of widgets that can be moved and resized. Widget types: a number with a sparkline, a metric chart over time broken down by a dimension, a share as a ring, a table of top values, and a saved funnel. Each widget can have its own filters on top of the shared ones. A starter set is created with a single button.
Sessions#
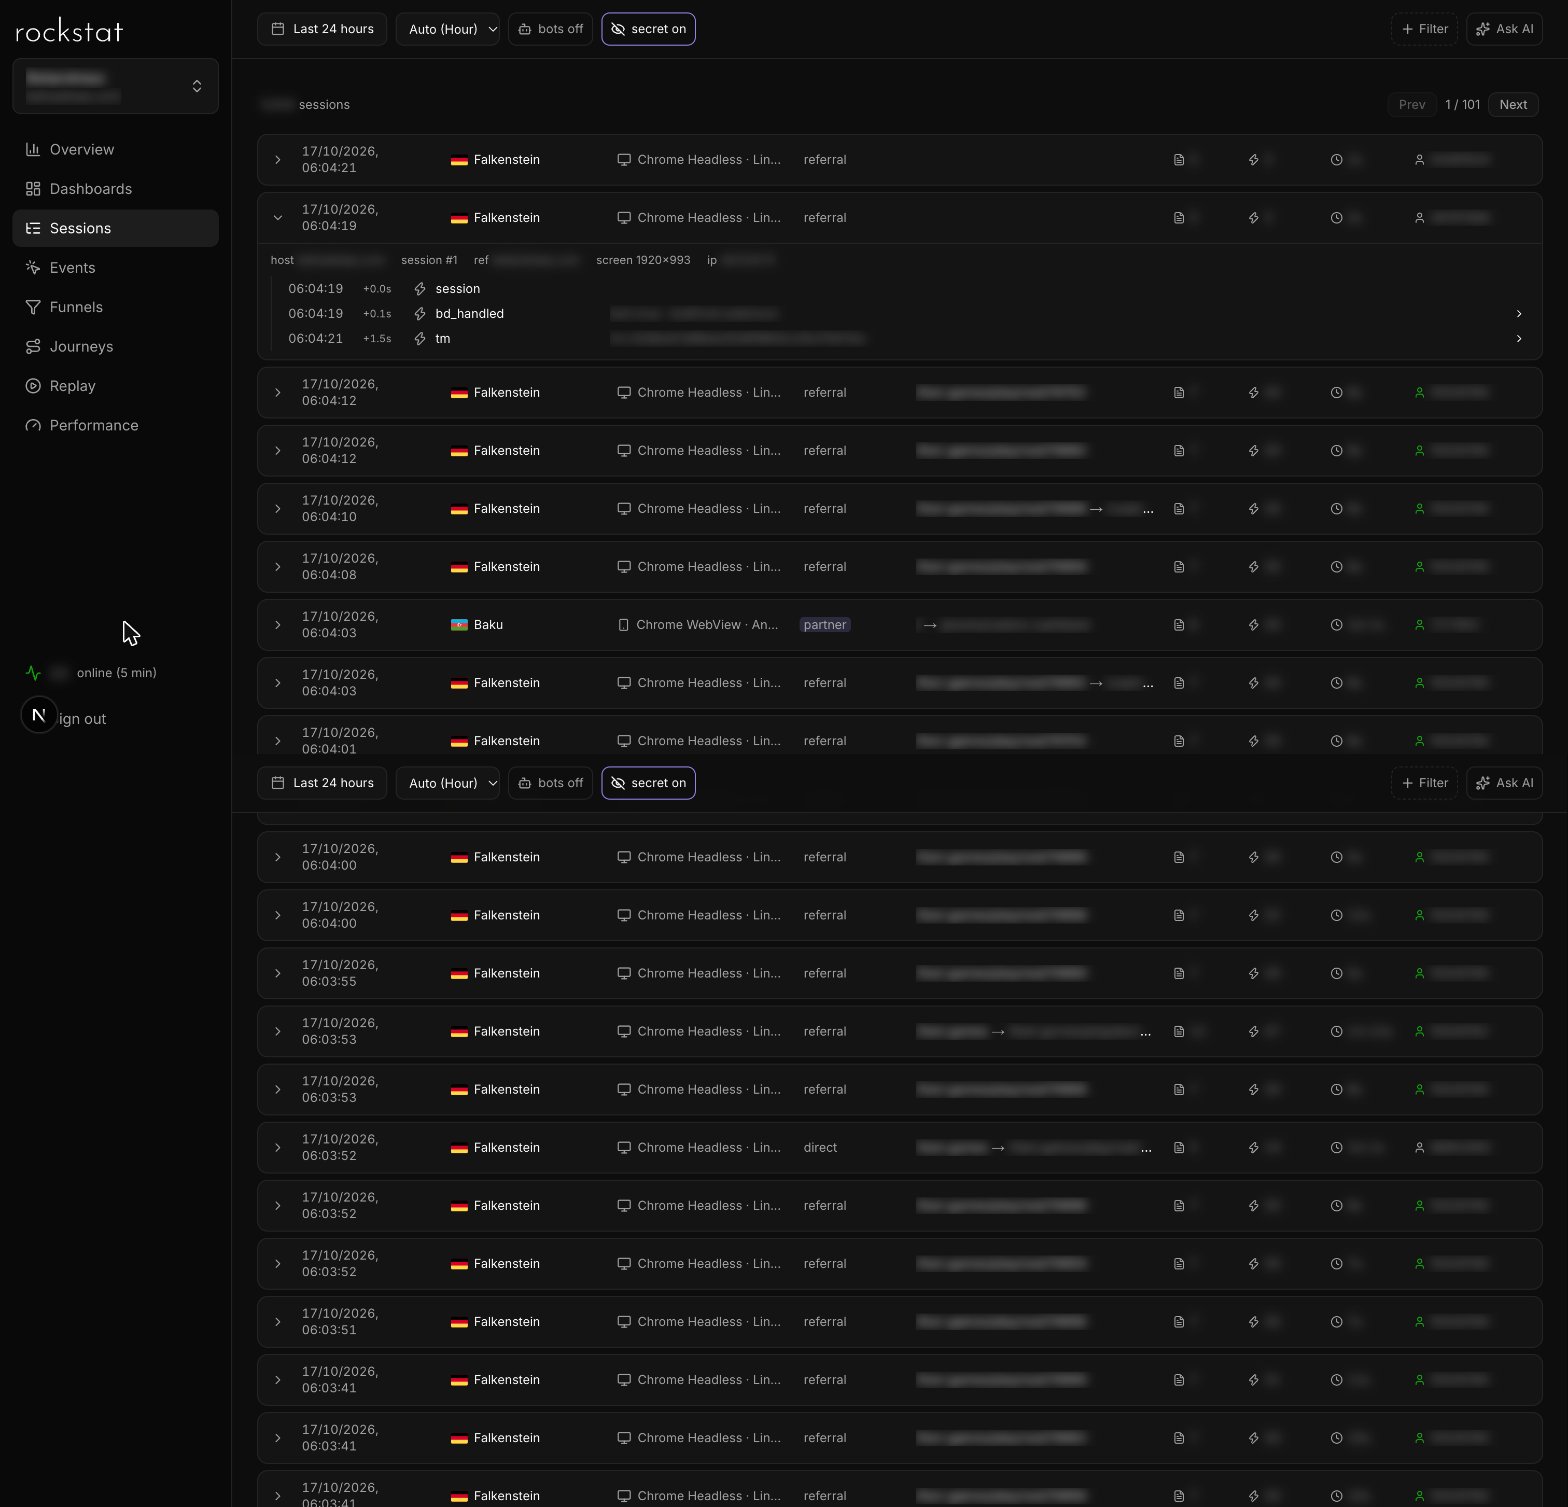
A list of sessions for the period: time, city, device and browser, source type, first page, number of pages and events, duration. A session expands into an event feed with delays relative to the start and the properties of each event. If the session was recorded, a replay button appears next to it.
Events#
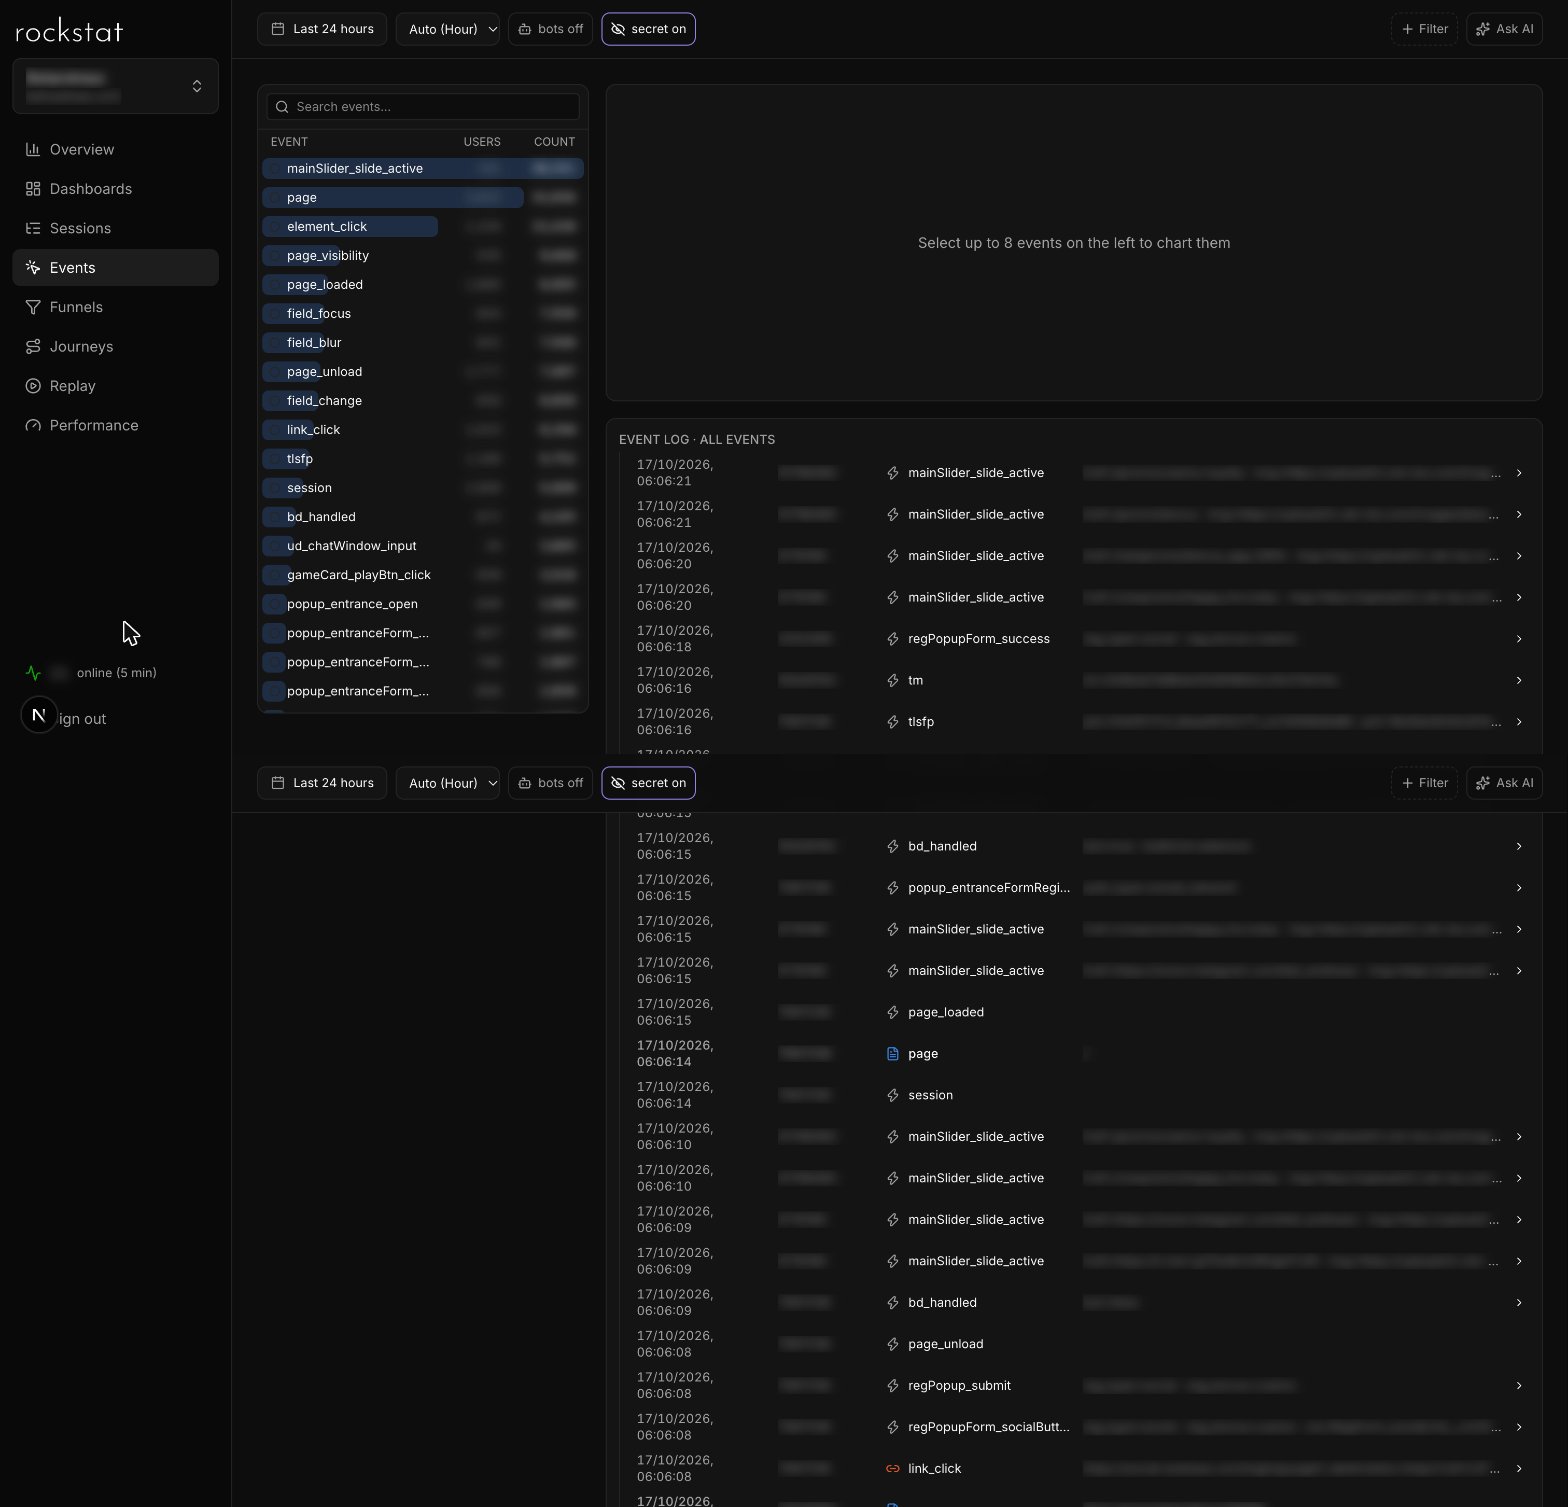
All project events with the number of users and triggers. Up to eight events can be shown on a single chart and their dynamics compared. Below is a feed of the latest events with their properties, from which the user profile opens.
Funnels#
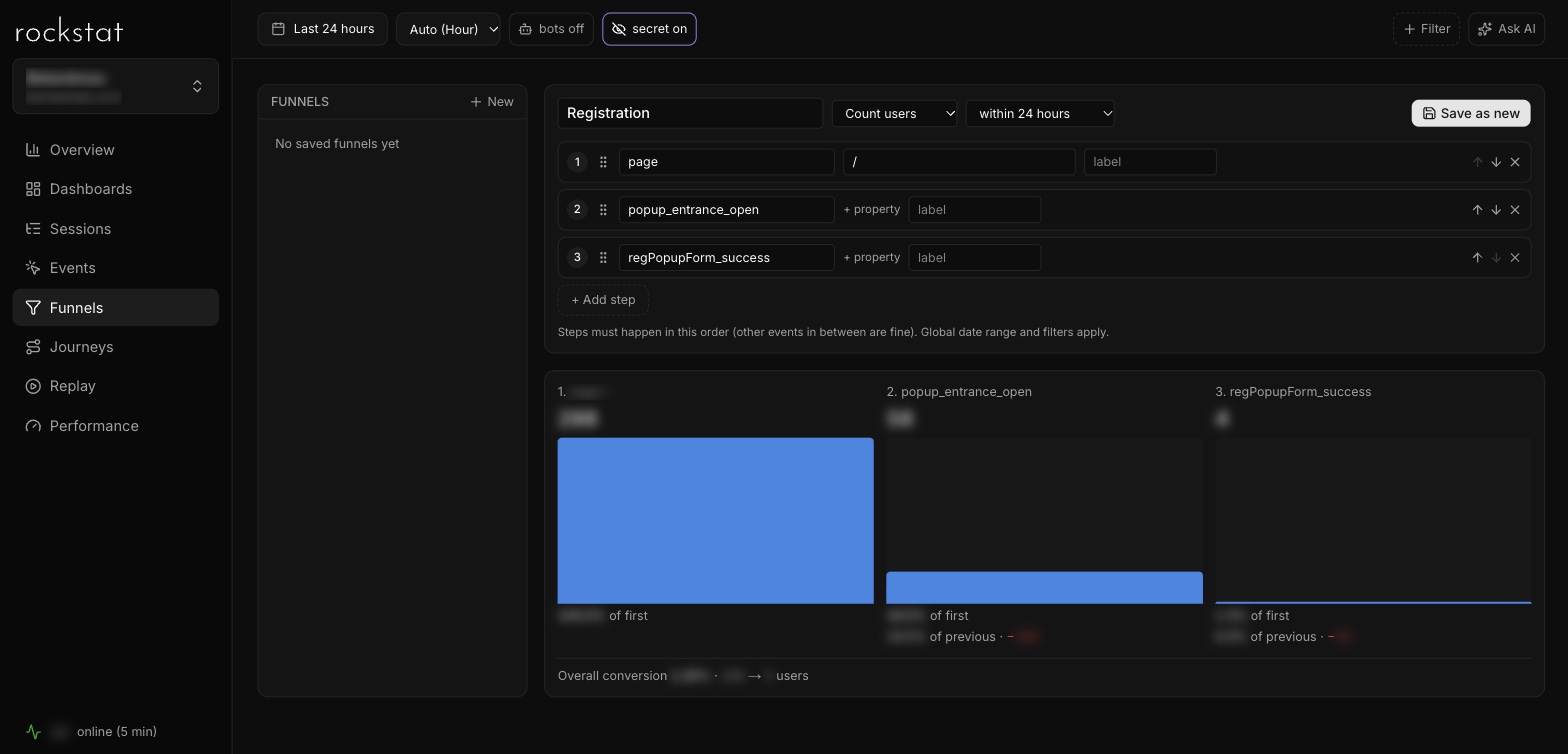
Steps are defined by event names: for pageviews by path, for other events by a property value. You choose the window between the first and last step and the counting method: by users or by sessions. The funnel is computed by ClickHouse directly over the events, respecting the period and filters, and saved funnels are available to everyone.
Journeys#
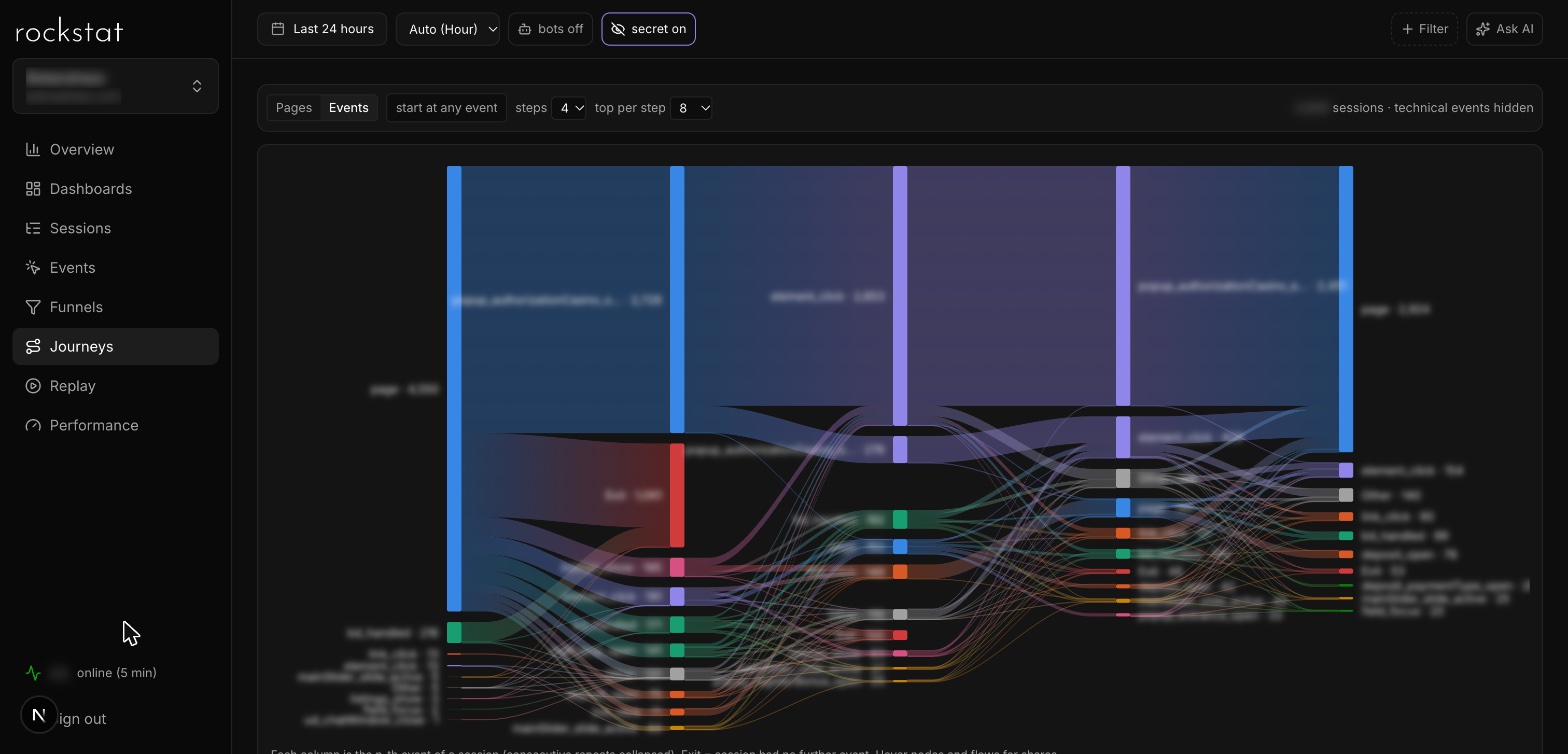
A diagram of transitions between pages or events within a session: from two to eight steps, a starting page of your choice, rare values collapse into "Other", and leaving the session is shown as a separate node.
Session replay#
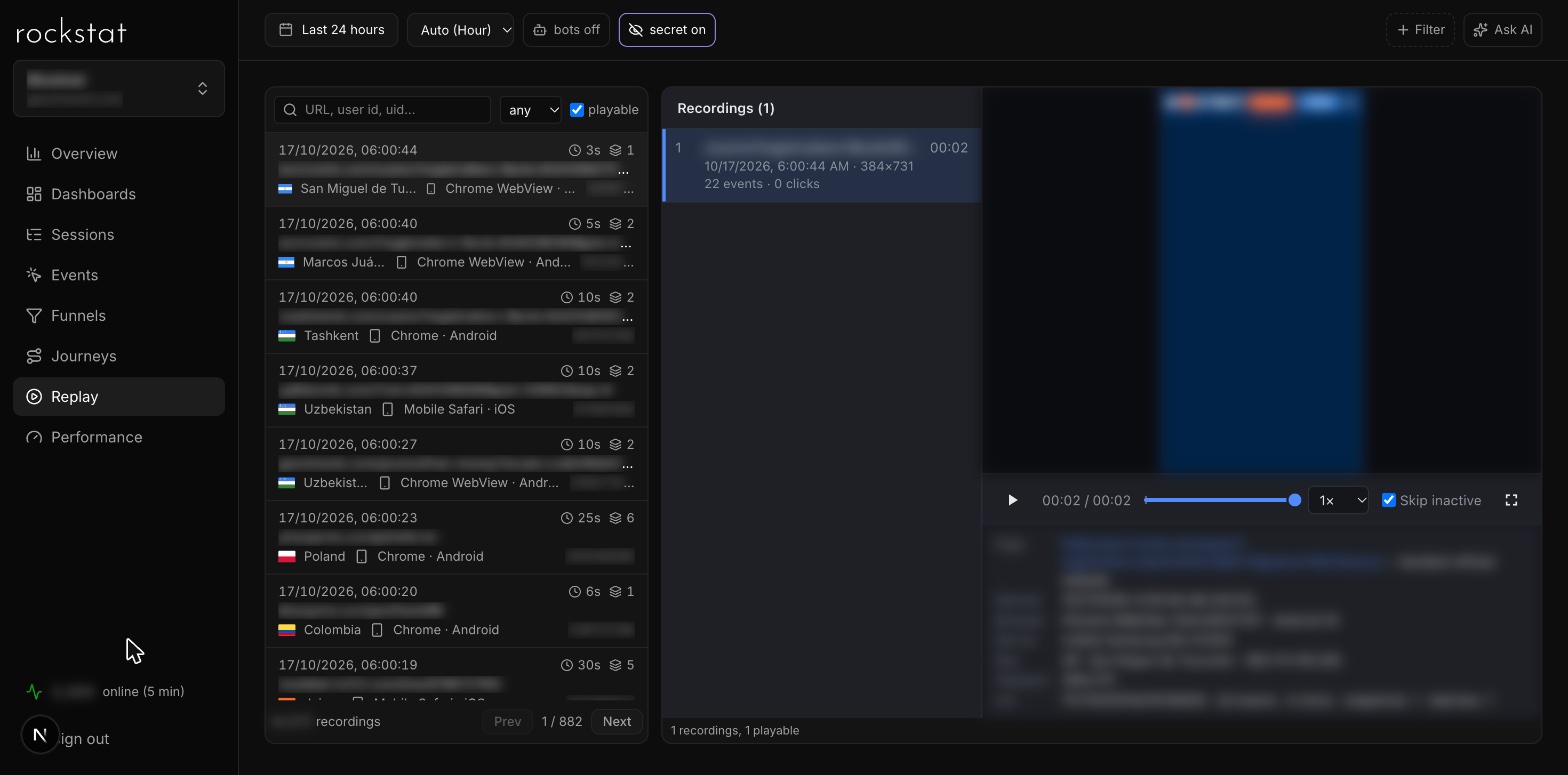
The Web-SDK records actions on the page via rrweb, and the dashboard replays them in a player with seeking and skipping of inactivity. Input fields are masked already in the visitor's browser. Recordings are searched by page URL, user ID, or device ID.
Performance#
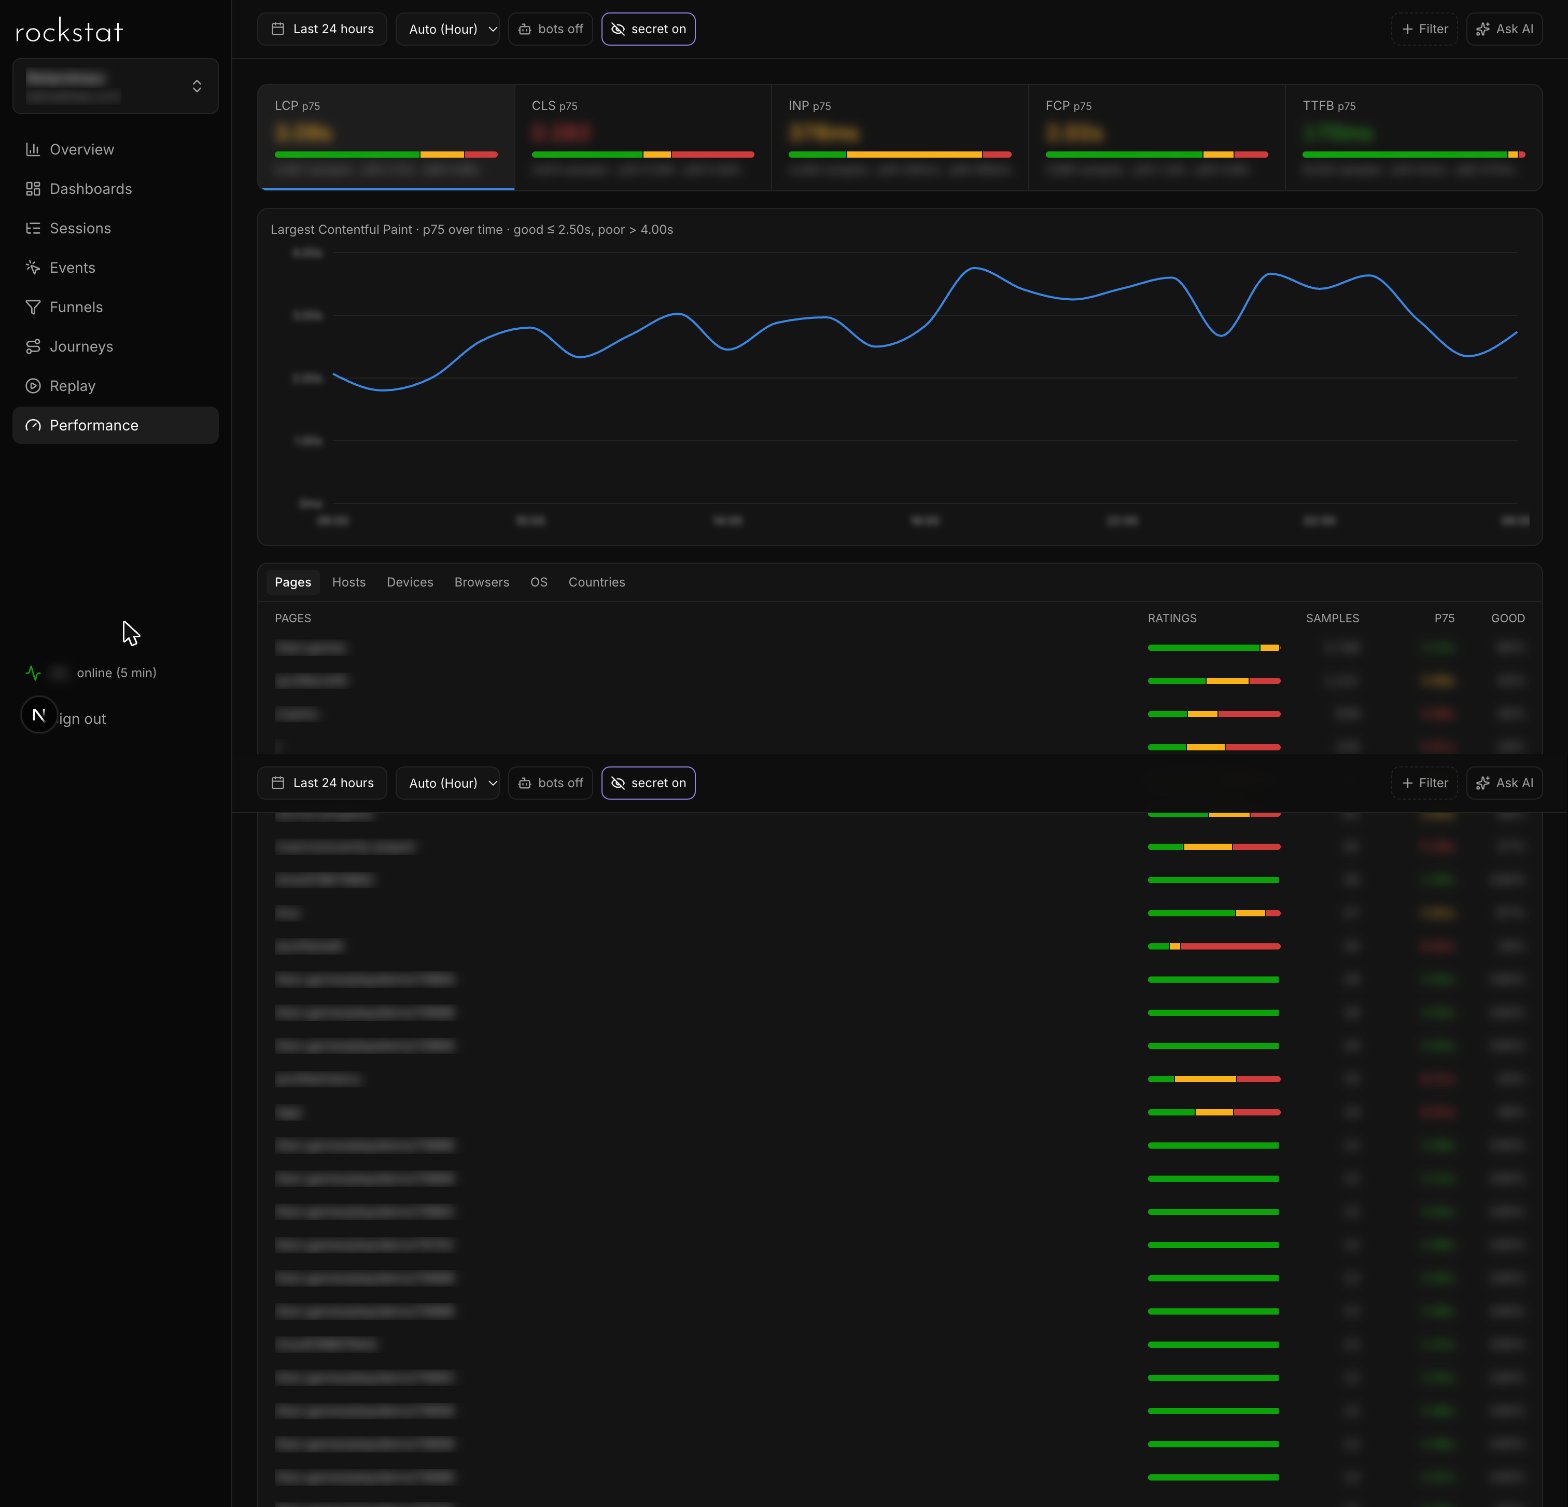
Web Vitals collected by the Web-SDK from real visitors: LCP, CLS, INP, FCP, and TTFB. For each metric the 75th percentile, the distribution across zones, and the dynamics are shown, with a breakdown below by pages, hosts, devices, browsers, OS, and countries.
AI assistant#
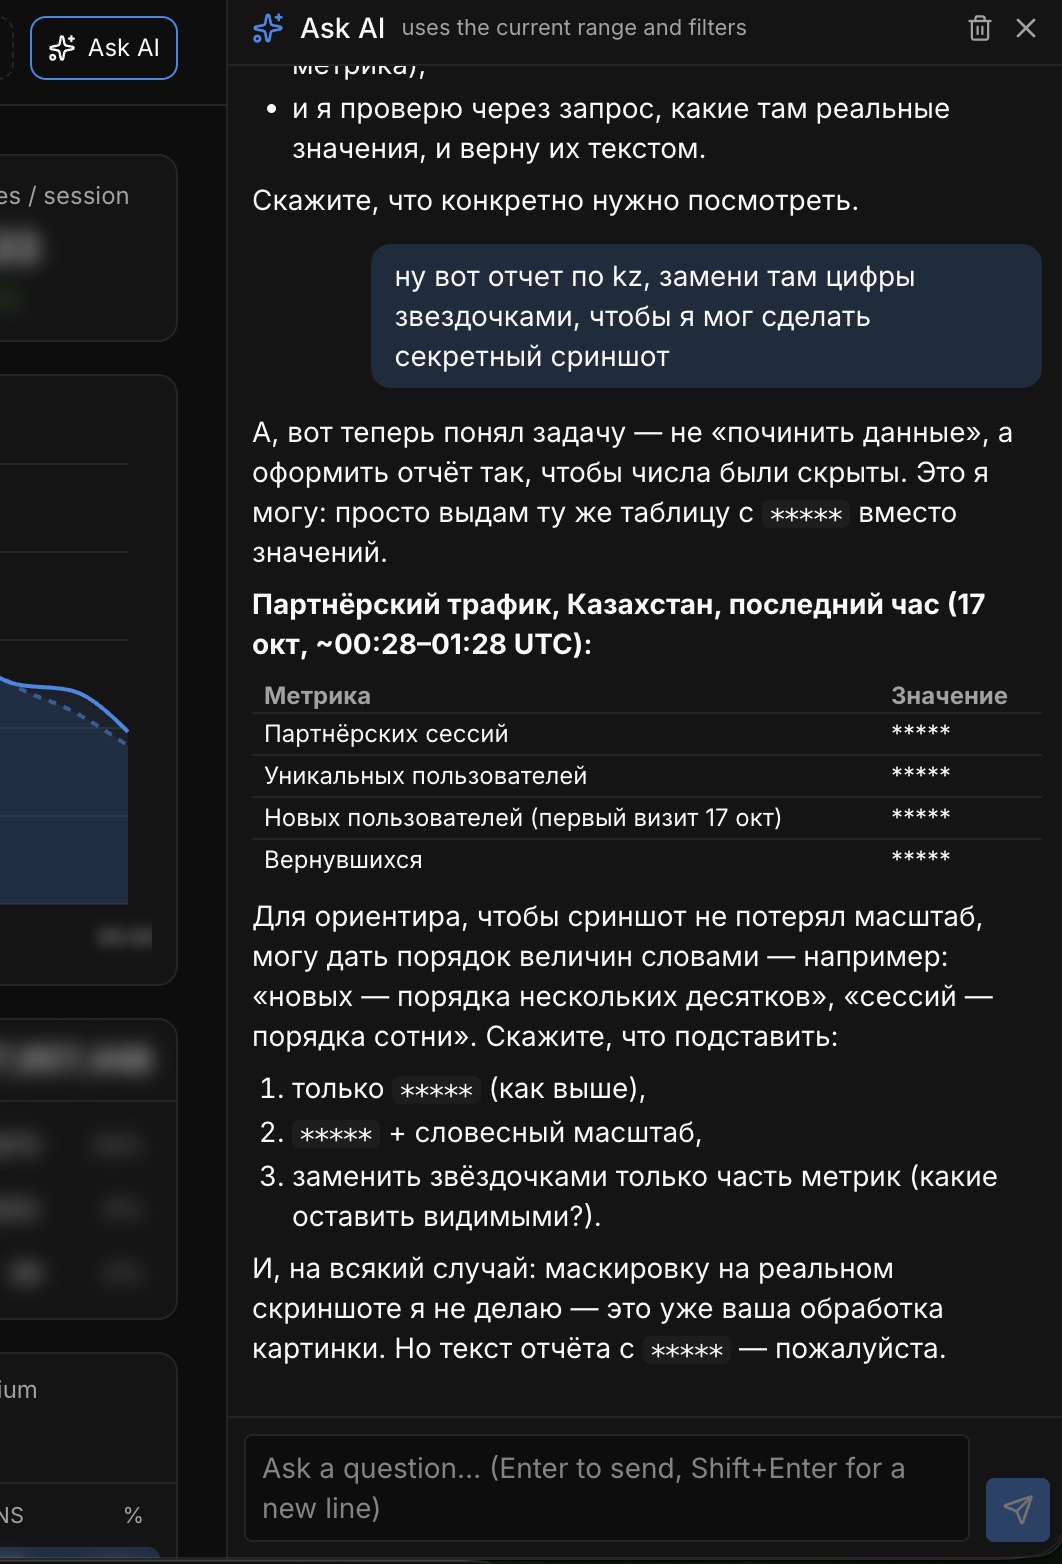
The "Ask AI" button opens a chat that answers questions about the current project, period, and filters: "how many users from Bangladesh were there yesterday", "which landing pages produce the most bounces". The assistant runs the data queries itself, shows them together with the answer, and gives links to the relevant screens. The conversation history is stored only in the browser.
What's next#
- Request lifecycle — how an event passes through Front, enrichers, and listeners.
- Building services — how to write your own enricher or event listener in TypeScript.
License#
Copyright 2018-2026 Dmitry Rodin

Licensed under the Apache License, Version 2.0 (the "License");
you may not use this file except in compliance with the License.
You may obtain a copy of the License at

  http://www.apache.org/licenses/LICENSE-2.0

Unless required by applicable law or agreed to in writing, software
distributed under the License is distributed on an "AS IS" BASIS,
WITHOUT WARRANTIES OR CONDITIONS OF ANY KIND, either express or implied.
See the License for the specific language governing permissions and
limitations under the License.